
OPERATIONS AND FEEDSTOCK
Process monitoring and data quality: know when a trend is real
A process trend is useful only when the instrument, timestamp, sample, and operating state are understood. Calibration paperwork helps, but data quality also depends on where the sensor sits, how fast the process moves, and whether the recorded value describes the current material.
Calibration is part of the result
NIST defines metrological traceability as a documented, unbroken chain of calibrations, each contributing to measurement uncertainty. That definition matters on a plant dashboard. A temperature, pressure, flow, or composition number needs an instrument identity, range, calibration status, method, and uncertainty appropriate to the decision. A certificate alone does not prove that every subsequent reading is traceable.
Record checks before use and after an event that could affect the instrument. A sensor may drift, foul, be installed in the wrong location, or be changed in software while the old tag remains on the screen. Control charts or check standards can reveal a shift that a single pass or fail check misses. NIST guidance describes monitoring stability and reproducibility over time as part of measurement assurance.
When a value is estimated, delayed, or copied from another system, label it. A clean data table with honest status fields is more useful than a precise-looking table that hides missing evidence.
References: 1
Account for measurement lag
A sample taken at the condenser outlet can represent material that entered the reactor earlier. A laboratory result may arrive after several batches have passed. A dashboard value can therefore be numerically correct and operationally late. Put the sample time, process time, analysis time, and batch or lot identifier in the record.
Lag changes decisions. If an oil property result arrives after the feed recipe has changed, assigning it to the current batch can lead to the wrong correction. If a pressure alarm is filtered or averaged, the operator needs to know whether the displayed value is instantaneous, a rolling average, or a delayed calculation. The display should not imply a faster response than the measurement system can provide.
Stable operating data should be defined before it is used for comparison. State the period, accepted operating range, exclusions, and the reason for excluding an event such as start-up, shutdown, maintenance, or an instrument fault. A short stable window may answer a narrow question; it cannot prove long-run reproducibility.
References: 3
Example decision
Suppose a gas composition analyser reports an abrupt change, while calibrated flow and pressure remain steady. Follow the approved alarm response first. When reviewing the data, check the analyser's sample line, timestamp, calibration status, and response lag. If the analyser is known to update ten minutes late, the apparent change may belong to the prior feed condition. A known delay helps investigators associate the result with the right operating period. It does not justify delaying an alarm response or bypassing a protective control.
The takeaway is to treat data as a chain of evidence. Preserve raw readings, calibration and check records, timestamps, sample identity, corrections, and operating-state labels. A trend becomes decision-grade when another person can reconstruct what was measured and when.
References: 3
Make records reconstructable
Keep tag or sample identity, units, transformations, alarm state, timestamp, and manual corrections. Preserve raw values when a gap is estimated. Use the same averaging and exclusion rules when comparing stable periods, and record those rules with the result. A reviewer should be able to follow a value from sensor or sample to dashboard and decision.
Compare instruments or check samples when a decision matters. Two values from different batches are not corroboration. Timing, sample identity, calibration status, and the calculation version must match well enough for the comparison to mean anything.
References: 3
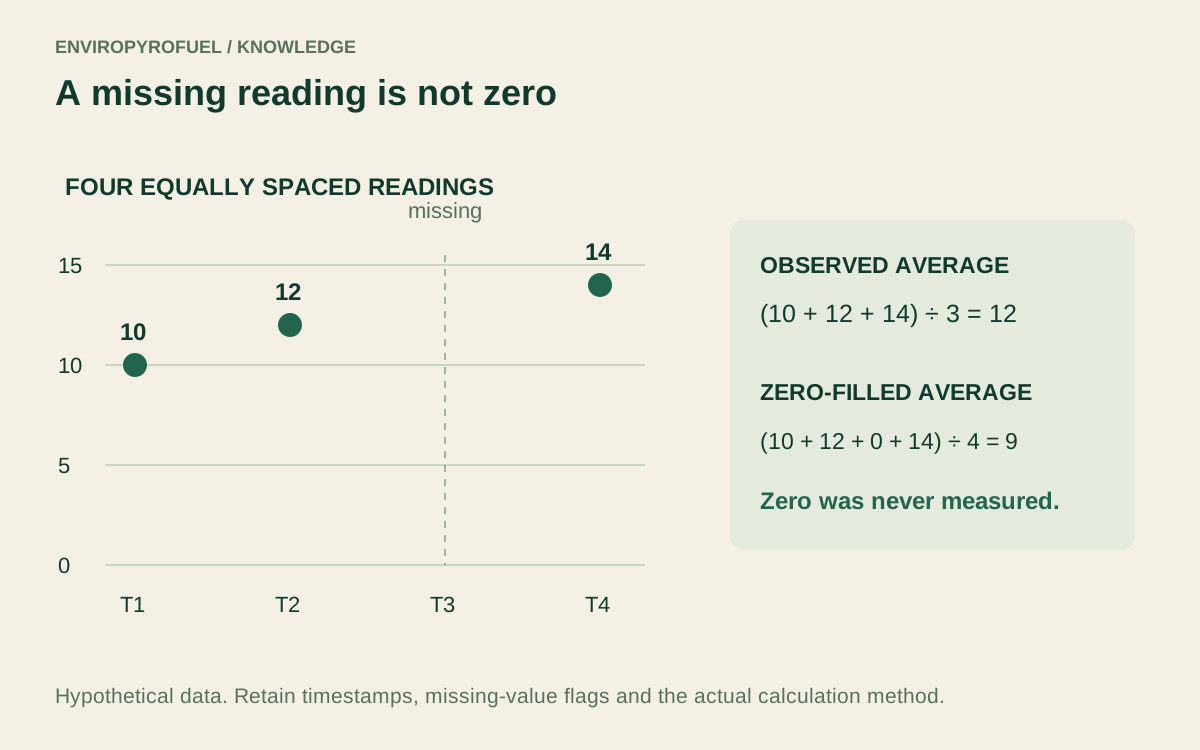
A missing reading is not zero
Consider four equally spaced readings: 10, 12, missing and 14. The average of the three observed readings is 12. Replacing the missing reading with zero gives 9 and falsely implies a measured low value. Interpolating a value creates an estimate, not another observation. A report should retain the missing state and declare the treatment used.
For irregular timestamps, an arithmetic average can also overrepresent periods with frequent sampling. Choose the averaging method for the question being asked and retain the timestamps needed to reproduce it. A dashboard can show a compact result while its underlying record preserves missing values, flags and calculation rules. This separation keeps presentation convenient without discarding the evidence needed for investigation.
References: 3
Sources and further reading
Sources support the principles discussed here. Worked examples and decision checklists are explanatory; they do not report ENVIROPYROFUEL plant performance or product specifications.
- Metrological traceability: frequently asked questions and NIST policy
- Quality assurance of the measurement process (NISTIR 6969)
- Monitoring bias and long-term variability
Apply testing, handling and operating decisions to the actual material, equipment and local requirements. A standards reference identifies a method or framework; it does not establish certification.