
BUYING AND CIRCULARITY
How to read a life-cycle assessment of tyre recycling
A life-cycle assessment result is tied to the question it models. For tyre recycling, changing the functional unit, system boundary or treatment of co-products can change the comparison even when the plant data stay the same. That is why the method belongs beside every numerical claim. The method section is part of the result, not background paperwork. Readers should be able to find these choices before comparing two published numbers.
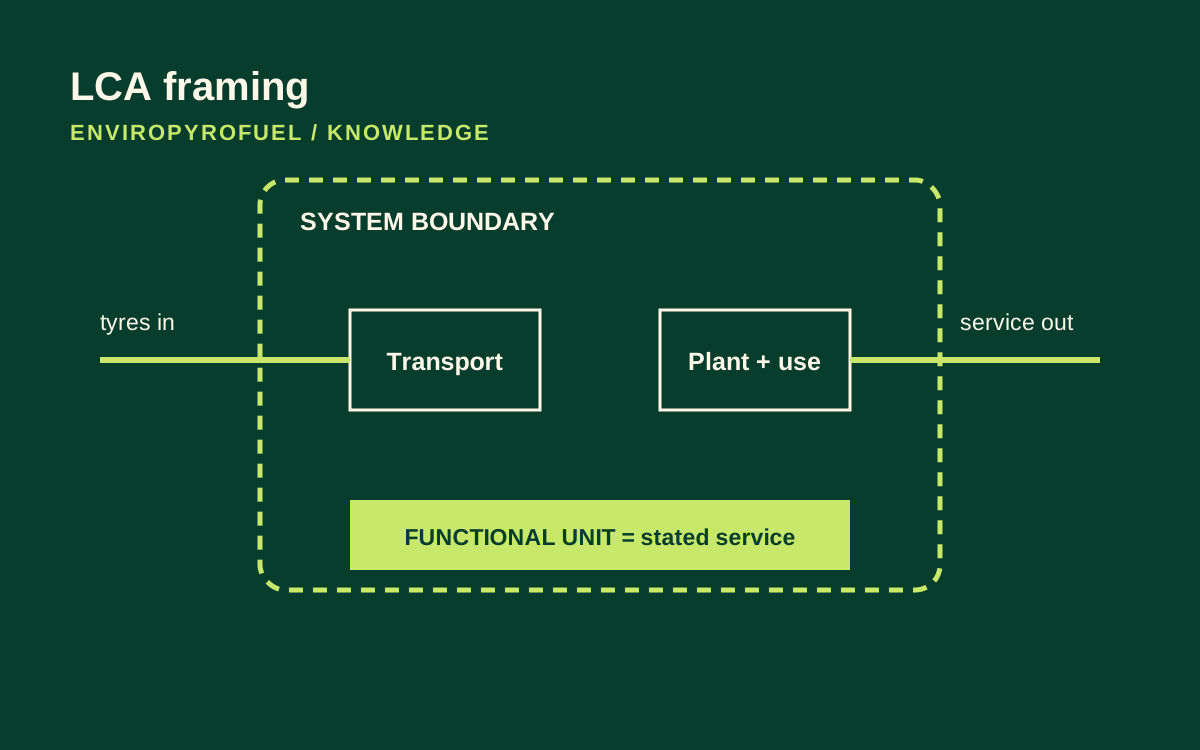
Start with the function
The functional unit is the quantified performance used as the reference for an LCA. One tonne of tyres processed measures plant throughput. It does not necessarily compare the same service as one megajoule of useful heat, one kilogram of qualified rubber ingredient or one tonne of recovered steel delivered to a mill. A fair comparison uses the service that the alternatives are meant to provide.
Write the reference flow beside the functional unit. If the study compares recovered oil with another fuel, specify useful heat, operating efficiency and delivered condition. If it compares carbon materials, specify the rubber performance being delivered, because equal mass does not mean equal reinforcement. ISO terminology provides the starting definitions; the study author must make the application explicit.
Draw the boundary before counting
List feed collection, preparation, reactor energy, internal gas use, condensation, separation, wastewater, residue treatment, storage, transport and end use. Then state which processes are excluded and why. A gate-to-gate plant study can answer a plant question; it cannot silently become a cradle-to-grave claim about tyre recycling.
Transport distance, electricity mix, auxiliary fuel, avoided landfill or avoided virgin production may sit outside a narrow boundary but matter to a broader comparison. Ask whether inputs are measured or estimated, whether infrastructure is included, and which life-cycle stages are common to both options. Boundary choices should be visible before a numerical result is quoted.
Handle several outputs openly
Tyre pyrolysis produces more than one output. The study must explain how burdens are assigned among oil, gas, carbon-rich solid and steel, and what happens to residues. Allocation by mass, energy, economic value or another relationship answers different questions. Avoiding allocation through system expansion can also change the credited products and the comparison route.
Read the sensitivity analysis. If a small change in price, yield, avoided product or transport moves the result from benefit to burden, that is decision information. It does not make the study useless; it tells the reader which data need better measurement before a procurement or investment decision.
Separate measured data from assumptions
A credible report labels primary plant data, laboratory results, database factors and scenario assumptions. Check moisture basis, energy units, yield definition and whether emissions are direct, purchased or avoided. Numerical claims depend on these definitions. A result from a pilot run may not represent a commercial operating year, and a literature yield may not match the stated feed.
Ask for uncertainty or sensitivity ranges, not only a single headline number. Review feed composition, uptime, electricity, transport, end-use efficiency and co-product displacement. If the study does not disclose these drivers, its precision is lower than the number of decimal places suggests.
Use the result for the stated decision
An LCA can compare defined systems under defined assumptions. It can inform a buyer about data requests, a designer about hotspots or a plant team about measurement priorities. It does not prove that every batch has the same impact, and it does not turn a modelled scenario into an observed saving.
Before using a result in a circularity statement, record functional unit, boundary, allocation method, data year, geography, end-use assumption and sensitivity range. A reviewer should be able to reproduce the direction of the claim from the report, even if the final number changes when better data arrive.
Keep the sensitivity cases tied to actual uncertainties. Changing grid electricity, transport distance or the assumed displaced material can answer different questions. Show which assumption changed in each case so that readers can identify the reason for the result rather than seeing only a range of totals.
| Check | Why it changes the reading |
|---|---|
| Functional unit | Defines the service being compared |
| Boundary | Determines which stages are counted |
| Allocation | Splits burdens across outputs |
| Scenario data | Sets geography, year and operating context |
| Version control | Study file, factor change and reviewer sign-off |
Sources and further reading
Sources support the principles discussed here. Worked examples and decision checklists are explanatory; they do not report ENVIROPYROFUEL plant performance or product specifications.
- ISO/TS 14076:2025, environmental techno-economic assessment — terms adapted from ISO 14040
- GHG Protocol Product Life Cycle Accounting Standard
- GHG Protocol, chapter on boundary setting and allocation
Apply testing, handling and operating decisions to the actual material, equipment and local requirements. A standards reference identifies a method or framework; it does not establish certification.